Quotidien Shaarli
June 20, 2026
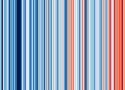
These ‘warming stripe’ graphics are visual representations of the change in temperature as measured in each country, region or city over the past 100+ years. Each stripe or bar represents the temperature in that country, region or city averaged over a year. The stripes typically start around the year 1900 and finish in 2025, but for many countries, regions and cities the stripes start in the 19th century or sometimes even the 18th century.
